This domain is for sale. If interested, please, contact us at pelhrimov[AT]yahoo.com for more details.
Heat map
Heat map
Heat map illustrates what users do when they are presented with a visual content. A heat map is usually constructed using eye-movement tracking equipment, but in case of a web site, heat map is usually created based on where users click. This article explains what heap map is, how heat map is used, and how you can get one for your web site.
What is heat map
A heat map is a graphical representation of data points in a two-dimensional area. Each data point has its coordinate X value and its coordinate Y value. The X and Y values determine where a data point is located in a plane. The density of points in a plane is represented on a heat map by colors.
Heat map originated in marketing where researchers used so-called pupil tracking equipment (or also eye-movement tracking equipment) to identify and map exactly where people look when they are presented with visual information. Heat map can provide useful information not only in marketing, but in web development as well. Web heat map is used for displaying areas of a web page that are most frequently scanned by visitors' eyes. A heat map can help you improve how much money you make with AdSense (See here for our Make money with AdSense guide for more tips related to this topic.).
When do I need heat map?
Certain locations within a web page tend to be more successful than others, and a heat map can discover which those are. When you have many thousands of visitors, but a low conversion rate, it is possible that your ad placement is not correct. A web page heat map is the tool that can help you to improve your AdSense earnings. (See here for more details about AdSense revenue: AdSense revenue.)
Heat map sample
Below you can find a few examples of heat map.
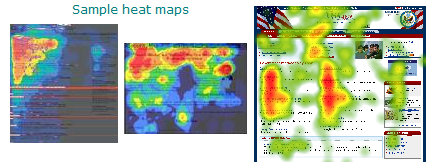
The colored spots demonstrate how many users viewed or clicked sections of the web page. The following is a guide to the colors.
| Color | Percentage viewed |
| Red | 80-100% |
| Brown | 70-80% |
| Yellow | 60-70% |
| Green | 50-60% |
| Light Green | 40-50% |
| Blues | less than 40% |
You can see that a heat map is not the same for all web sites. Heat map varies by content. Nevertheless, you can also see that heat maps have something in common. Most visitors emphasize the left side of the screen above the fold.
Google heat map
Google provides sort of a heat map in their AdSense section (https://www.google.com/adsense/support/bin/answer.py?hl=en&answer=17954). They describe the heat map as an illustration of ideal placements for content and AdSense ad units on a sample page layout. The Google heat map displays sections in colors from white to dark orange (or red) where dark orange (or red) represents strongest performance and white means the weakest performance.
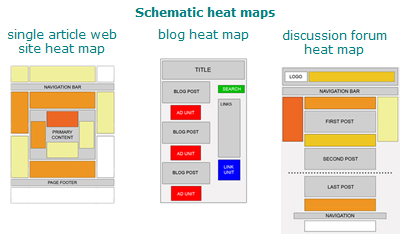
You can see that a heat map is not the same for a general-single-article type web site and for a discussion forum and a blog. Each format has its specifics and visitors behave differently. However, all three heat maps provided above have something in common: all three heat maps integrate ads into or place ads as close as possible to the content.
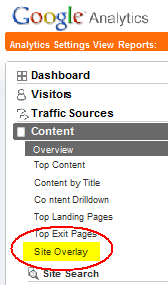
Heat map in Google Analytics
You can find functionality called Site Overlay in your Google Analytics account. Although this functionality is not as nice graphical representation of heat map as shown above, you can still use it for your purpose.
 provides heat map like this
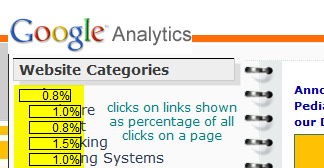
It is not quite like the heat map provided earlier on the page, but it can provide a lot of useful information.
Where can I get real heap map of my web site
Pupil tracking equipment is quite expensive, and if you wanted to get a heat map of your web site created the original way, you would have to spend quite a lot of money. The pupil tracking equipment that researchers use to generate heat map has astounding capabilities, but it may be hard to justify the expense.
There is a way how you can create a heat map of your web site. This heat map method is based on where users click. To create a heat map, you can capture the coordinates of each visitor's click and then draw these points on a transparent layer above your web page. You just need a bit of javascript and server side programming. Here is a link to the heat map generator:http://blog.corunet.com/english/the-definitive-heatmap
Now, let's see how you use heat map.
How do I use heat map
Most of your web site activity occurs in the heat map primary zone as shown in the attached pictures. It means that if you want to improve your conversion rates (e.g. Click-Through-Rate), you need to plan your web site design and layout very carefully. You have to answer the following questions with respect to your heat map:
- What do I place into each section of the heat map to maximize my conversion rates? Should I place an ad into the primary zone, or an article that points to an ad?
- What conversion techniques should I consider for my heat map primary zones? Should I use some "register" functionality, or "download" link, or a click-through ad unit, or anything else?
Different web sites work differently, and you most likely will have to experiment with this. Nevertheless, in general and all other things being equal,
- ads located above the fold tend to perform better than those below the fold,
- ads placed near rich content and navigational aids usually perform well because visitors are focused on those areas of a page,
- ads placed directly below the end of an article tend to perform very well because users look for more resources after being done reading the article, and targeted ads can provide answers for them.
Making changes in the placement of your ads can make a great difference in your conversion rates and your AdSense earnings as well (See AdSense earnings sample from one very successful web site).
Other articles related to heat map
In addition to heat map, you might be interested in the following articles that also relate to web development and monetization.
Avoid pagerank sculpting and increase your AdSense revenue
AdSense bid gap
How to find cheap AdWords keywords
How to increase Google crawl rate
How to add URL to Google
Your Sitemap does not appear to be in a supported format
You are also welcome to check out the resources below, for example our SEO discussion forum.
.
Discuss this article or this topic in our discussion forum:
(The table bellow shows a list of 8 most recent topics posted in our discussion forum. Visit our discussion forum to see more. It is possible the links below are not related to this page, but you can be certain you will find related posts in the discussion forum. You can post one yourself too.)
Email this article to a friend:
.
How can I link to this web page?
It is easy, just include the code provided below into your HTML code.
 Delicious
 Digg
Digg StumbleUpon
 Furl
Furl Facebook
 Google
 Yahoo
Yahoo
Maxi-Pedia
Search Maxi-Pedia
Interesting Topics
Related Topics
Favorite Topic
More Details
Selected Topics
Maxi RSS Feeds


