Robin Hood Index
Robin Hood Index
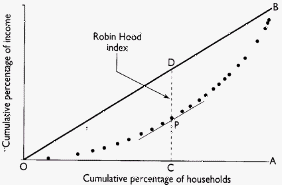
The Robin Hood Index is conceptually one of the simplest measures of inequality used in econometrics. It is equal to the portion of the total community income that would have to be redistributed (taken from the richer half of the population and given to the poorer half) for the society to live in perfect equality.
The Robin Hood index is based on the Lorenz Curve and is closely tied to the better known inequality measure the Gini coefficient which is also based on the Lorenz curve.
In layman words, the Robin Hood index is the proportion of money needed to be transferred from the rich to the poor to achieve equality.
How the Robin Hood Index is calculated
The Robin Hood index is equivalent to the maximum vertical distance between the Lorenz curve, or the cumulative portion of the total income held below a certain income percentile, and the Perfect Equality Line, that is the 45 degree line of equal incomes.
The value of the index approximates the share of total income that needs to be transferred from households above the mean to those below the mean to achieve equality in the distribution of incomes.

The Robin Hood index values
The Robin Hood index is a measure of income inequality ranging from 0 (complete equality) to 100 (complete inequality).
The Robin Hood index real world implications
Some economists argue that the size of the gap between the wealthy and less fortunate seems to be related to mortality.Policies that deal with the growing inequities in income distribution may have a considerable impact on the health of the population as a whole.
Alternative names to the Robin Hood index
The Robin Hood index is also known as the Hoover index.
The Robin Hood index in the USA
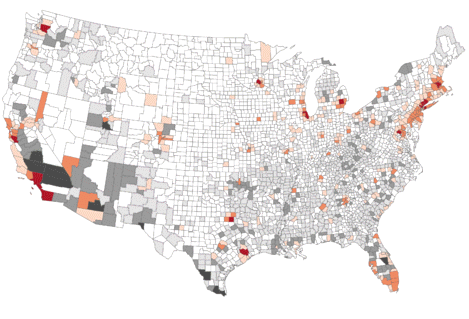
Black and dark grey areas contribute to overall US income equality while red and orange areas widen the overall US income inequality.

It is easy, just include the code provided below into your HTML code.
 Delicious
 Digg
Digg StumbleUpon
 Furl
Furl Facebook
 Google
 Yahoo
Yahoo

